Can a superfluid form a crystal?
A fluid with the spatial structure of a solid, but the frictionless flow properties of a superfluid!
I was invited to write this article for Physics in Canada, the magazine of the Canadian Association of Physicists (CAP), after winning some oral presentation competitions at the 2021 CAP Congress. Unfortunately some editorial issues meant that this article was never published. 😢 I’ve updated it slightly to publish here; this version combines it with my 2021 research thread about work with Rufus Boyack and Joseph Maciejko published in 2022.
The liquid to solid phase transition
In a seminal paper published in 1937 [1], the great Soviet physicist Lev Davidovich Landau decried the scientific discourse surrounding the liquid-solid phase transition. He wrote:
“One even finds the strange statement that there is no essential difference at all between liquids and crystals, and that continuous transitions between them are possible. However, liquids differ essentially from crystals in that they are isotropic in contrast to anisotropic crystals. Every transition from a crystal to a liquid or to a crystal of a different symmetry is associated with the disappearance or appearance of some elements of symmetry.”
Lev Landau, On the Theory of Phase Transitions I (1937)
With these fateful words, Landau set the stage for our modern classification of phase transitions as symmetry-breaking processes. However, Landau probably would not have imagined that this same classification could lead to a state of matter which blurs the liquid-solid distinction: a superfluid crystal, or supersolid state.
The search for a supersolid
The conceptual roots of supersolidity can be traced back to 1960, when Eugene Gross calculated the appearance of long-range spatial order in the ground state of a system of interacting bosons. [2] A supersolid would combine the periodic spatial order of a crystal with the frictionless flow of a superfluid.
In 2004, an abrupt change in the period of a torsional oscillator containing solid helium-4 was interpreted as the first experimental evidence of a solid-to-supersolid transition. However, this proved to be a false dawn, with later work connecting the apparent supersolid signal to elastic stiffening of the solid. [3]
The eventual experimental observation materialized via a superfluid-to-supersolid phase transition in ultracold gases, with particular success in dipolar Bose-Einstein condensates (BECs). In 2019, three groups observed spatial ordering and phase coherence together in these gases. [4]
The superfluid crystal in helium-3 is closely related to these supersolid states. Here we have Cooper pairs instead of bosonic atoms, so people generally use the term pair-density wave (PDW). The two names describe the same basic idea here: superfluidity and crystalline order coexisting in one phase. In helium-3, the periodic structure is in the Cooper-pair order parameter.
Superfluid helium-3
The superfluid behaviour of helium-3 was discovered in 1972 by David Lee, Doug Osheroff and Bob Richardson, for which they later won the Nobel Prize in Physics. This was many decades after the same phenomenon was discovered in helium-4, the more common isotope of helium.
This delay was because helium-3 is a fermion, and must first form a Cooper pair to transition into its superfluid phase. The Cooper pairing in helium-3 results in a much more fragile state than that of bosonic helium-4, and thus helium-3 requires lower temperatures for superfluidity.
The Cooper pairing also means that there can be many different phases of superfluid helium-3; in the language of Landau, the symmetry group of helium-3 is larger than helium-4, and can be broken into many distinct subgroups. In the laboratory setting, it was established that the phase diagram of bulk superfluid helium-3 at zero magnetic field contained only two thermodynamically stable superfluid phases: the A and the B phases.
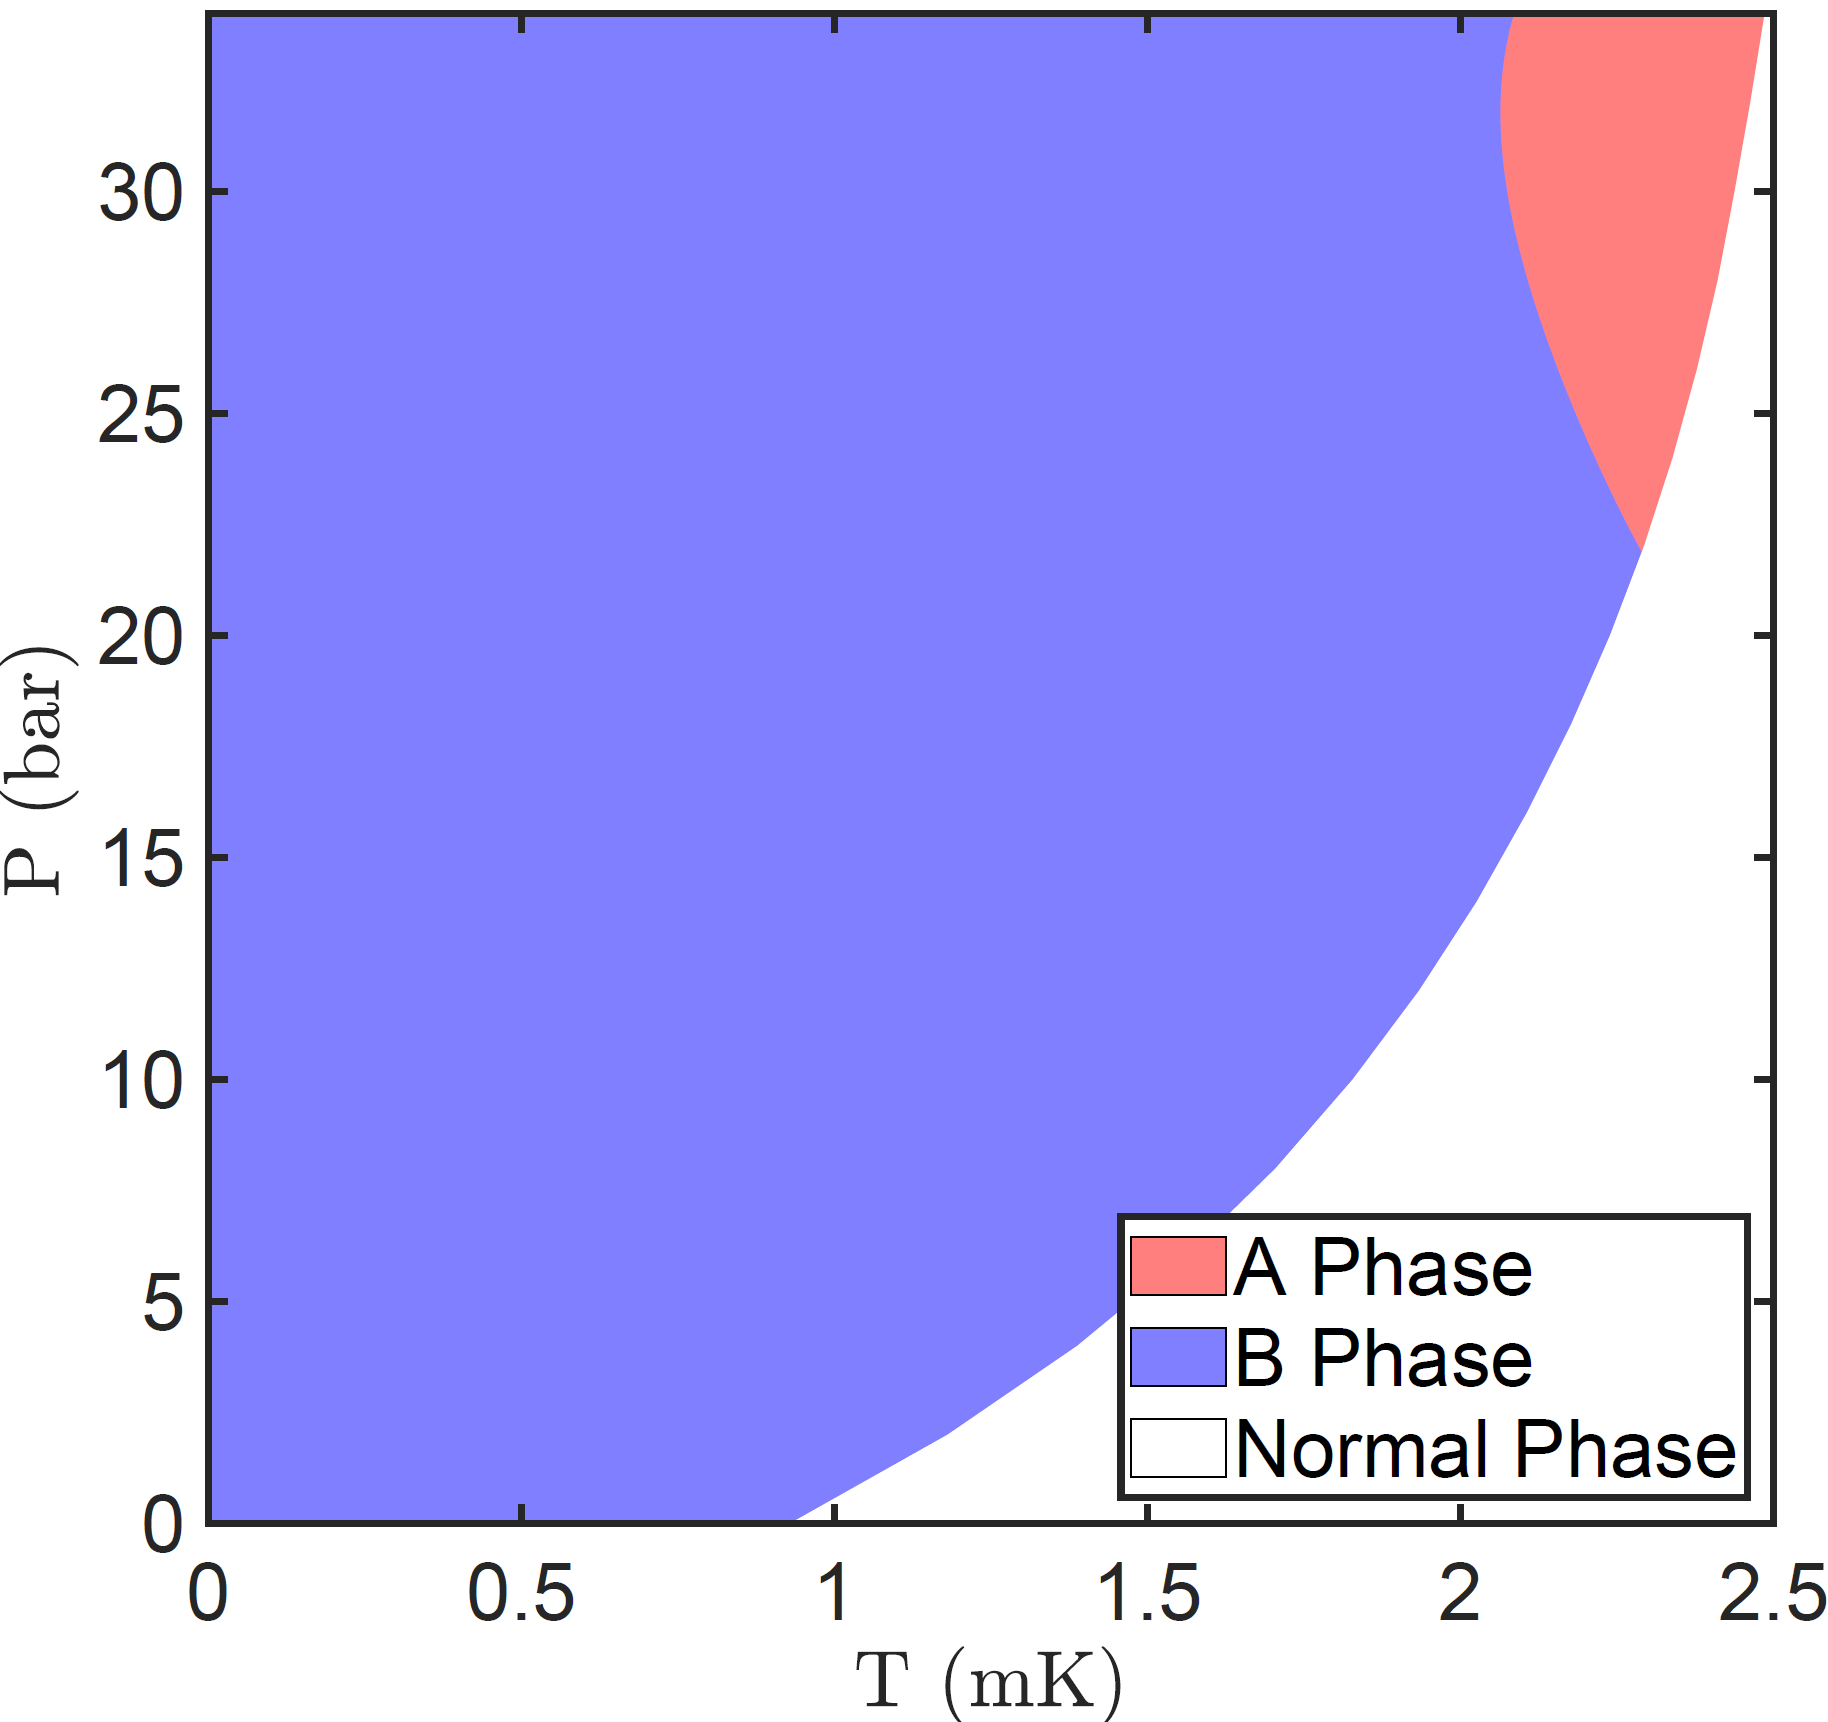
But as experimental techniques and nanotechnology became more sophisticated, physicists began to wonder about the confined phases of superfluid helium-3: can you make new phases by restricting the geometry of the container in which the superfluid lives?
Stripes or polka dots?
In 2007, a theory paper by Anton Vorontsov and Jim Sauls [5] considered this exact situation: confining the superfluid into a slab. The top and bottom surfaces interfere with the Cooper pairs, leading to reduced superfluidity. They found that this interference could be counteracted by the superfluid forming a periodic variation of its pairing order along the plane: a pair-density wave.
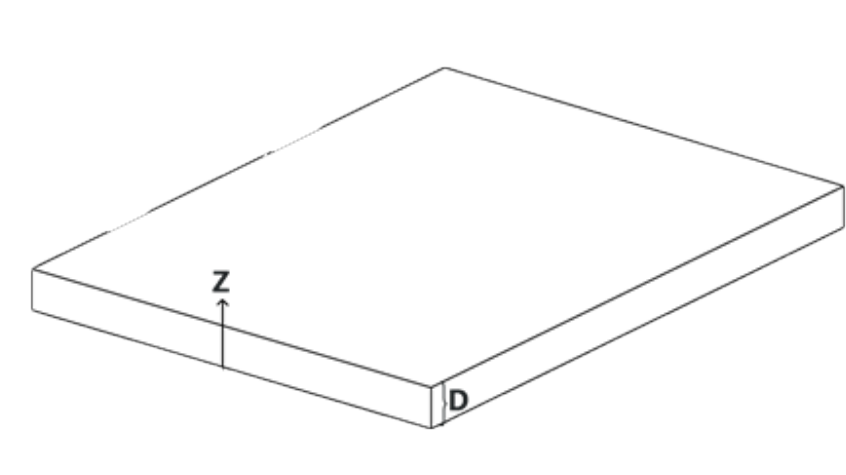
 , extending along both in-plane directions.
The predicted PDW varied along one direction, while remaining homogeneous in the other. It was dubbed a ‘stripe phase’: a zero-viscosity liquid with the periodic spatial order we expect to see in solids!
But in 2019, a Royal Holloway–Cornell experiment [6] found an NMR signature inconsistent with stripes. It instead suggested modulation along both in-plane directions; something like a ‘polka dot’ phase. In 2020, John Davis’s group at the University of Alberta [7] found a new phase sandwiched between A and B, which we interpreted as a PDW.
So the ball was back in the theorists’ court: why is this two-dimensional pair-density wave stable? And what is its actual crystal structure?
Collective modes of helium-3
These questions about the stability and structure of the PDW were what we tackled in our work. We used Ginzburg-Landau (GL) theory to calculate the energy cost of small changes in the order parameter. Different combinations of its components give different collective modes.
The helium-3 order parameter
To understand this superfluid order parameter, we need to understand that helium-3 is a spin-triplet, p-wave superfluid. This means that the spin and the orbital angular momentum of the Cooper pairs are both equal to 1:  . We need separate components for each spin and orbital direction, and thus there are
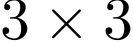 or 9 complex-valued components in the order parameter matrix.
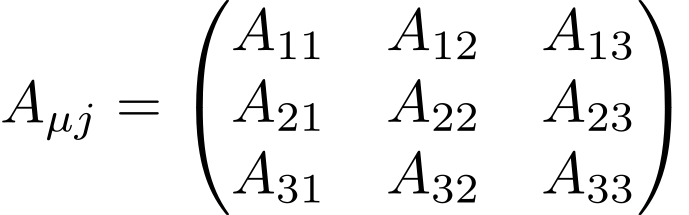
The  is for spin, and
 for the orbital direction. Under confinement, the B phase is distorted by the surfaces. This planar-distorted B phase, or PDB phase, is the background about which we calculate fluctuations.
How do we calculate the energy cost?
We start from the Ginzburg-Landau free energy of helium-3. It contains the energy of the local pairing state and the cost of varying that state in space:

The local terms contain the quadratic coefficient  and five quartic coefficients
 . The gradient terms contain the coefficients
 . Their values, along with the surfaces and slab thickness, determine the equilibrium pairing state.
The full functional used in the paper
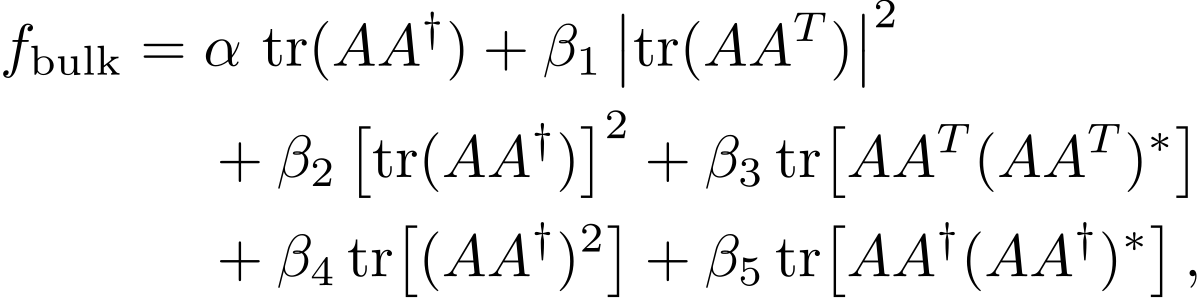
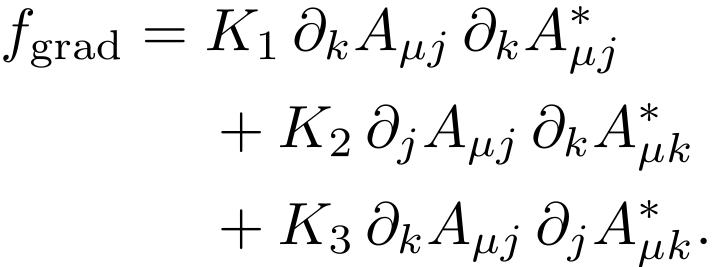
Repeated spin and orbital indices are summed. This is Eq. (1) of our paper, separated into local and gradient terms.
We first find the background state, then add a small fluctuation with in-plane wavevector  :

Expanding the free energy to second order in this fluctuation gives a Hermitian operator. We calculate its eigenvectors (the collective modes) and eigenvalues:

After subtracting the background energy and dividing by the sample area, the quadratic contribution becomes:
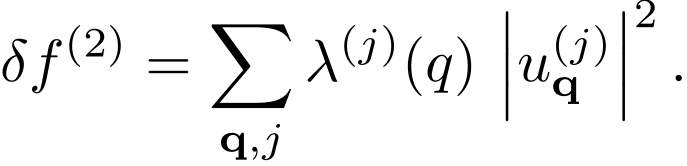
Here  is the amplitude of a collective mode; the superscript
 labels the mode. The eigenvalue
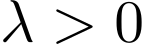
 is its quadratic energy-cost coefficient. Positive resists that fluctuation. Negative means the background can lower its energy by developing it. The cubic and quartic terms then determine the transition and the resulting structure.
Four Goldstone modes
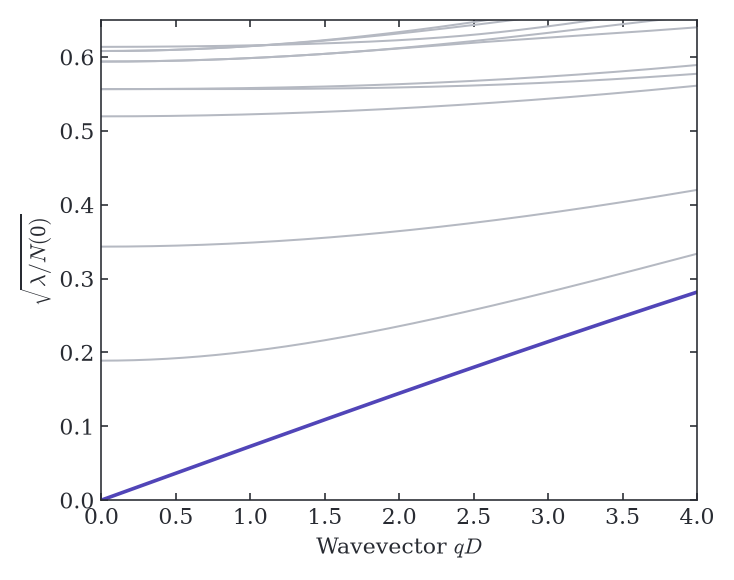
The planar-distorted B phase breaks four continuous symmetries, so we expected four Goldstone modes: one for the superfluid phase, and three for spin and relative spin-orbit rotations.
Plotting 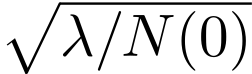 , which is proportional to the collective-mode frequency, gives one imaginary and three real linearly dispersing modes near
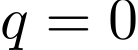 . Finding all four was a useful check on our calculation.
Gapless collective modes
 ·
 ·

Imaginary order-parameter fluctuations
Real order-parameter fluctuations
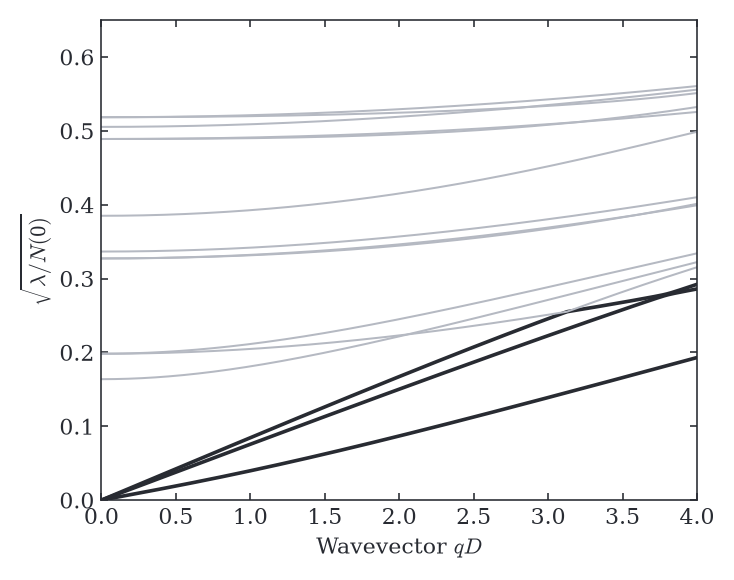
Coloured curves are the Goldstone branches; grey curves are gapped modes. ‘Real’ and ‘imaginary’ refer to fluctuations of the order parameter.
A mode softens at finite q
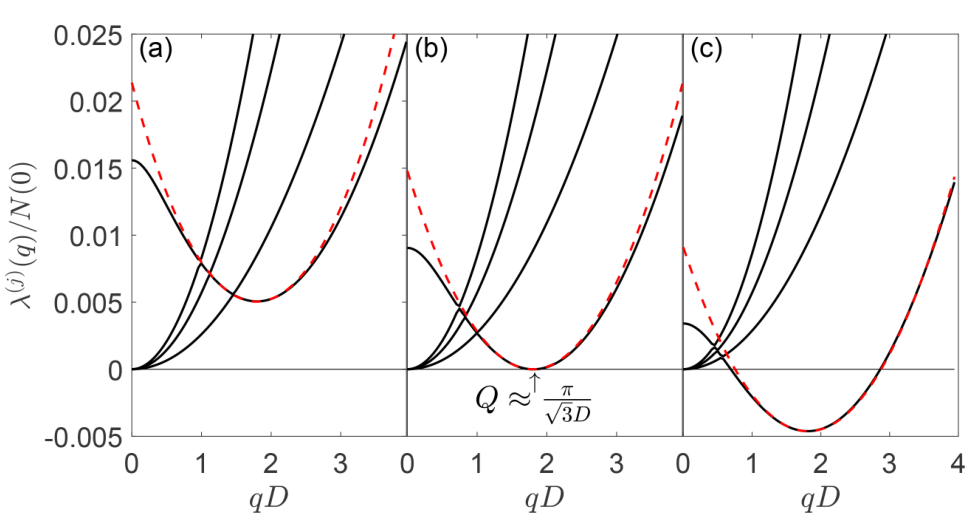
Now we focus on the real order-parameter fluctuations and plot itself. The three quadratic branches near are the three Goldstone modes from above; taking their square root gave the linear dispersions.
As we increase the temperature, an additional mode bends downward, or ‘softens’, at a finite wavevector. Once its eigenvalue becomes negative, that modulation lowers the energy of the background state. Its square root would now be imaginary, so plotting lets us follow the instability through zero.
This is also the stability criterion used in the superconducting Peierls poster. Move the temperature slider below to see it happen.
The energy cost of a pairing fluctuation
Real fluctuations · · Loading interactive figure…
 Deformation costs energy
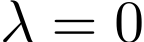 The mode softens
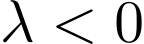 Deformation lowers energy
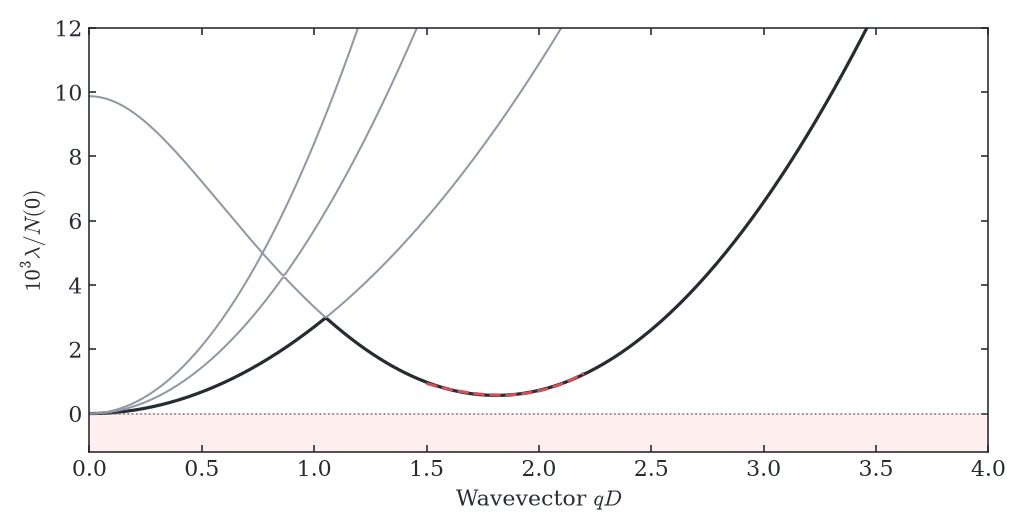
Solid curves: collective-mode eigenvalues. Red dashes: the approximation near the soft minimum. The vertical axis shows 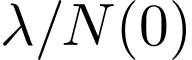 in units of
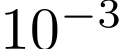 .
Figure 2 from the paper
Landau’s weak crystallization
Using this soft mode, we can construct a GL theory of the crystallization transition. Landau’s idea of weak crystallization tells us which pattern is favoured.
A cubic term in the free energy favours three wavevectors that add up to zero. One wave gives stripes; three equal-length waves pointing 120° apart give a triangular lattice. This is how we predict the crystal structure of the superfluid!
The cubic term also makes the transition first order: the PDW can become favourable before the background’s stiffness reaches zero.
Stripes and triangular order
Three wavevectors add up to zero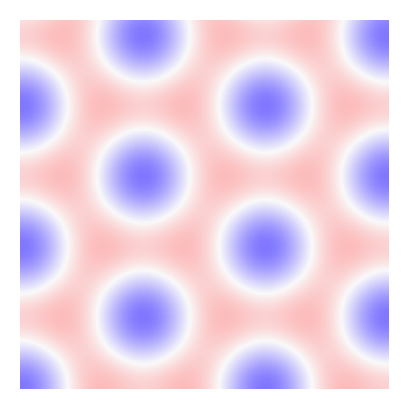
The cubic term in the free energy
For the three mode amplitudes ψ₁, ψ₂ and ψ₃, the cubic term contains ψ₁ψ₂ψ₃ plus its complex conjugate. This term survives the spatial average when Q₁ + Q₂ + Q₃ = 0. The three-wave combination can lower the free energy.

The cubic term allows a nonzero minimum to become favourable while the quadratic coefficient is still positive. This is why the first-order transition precedes local softening of the background. We calculate the coefficients from the confined superfluid.
Results: the phase diagram
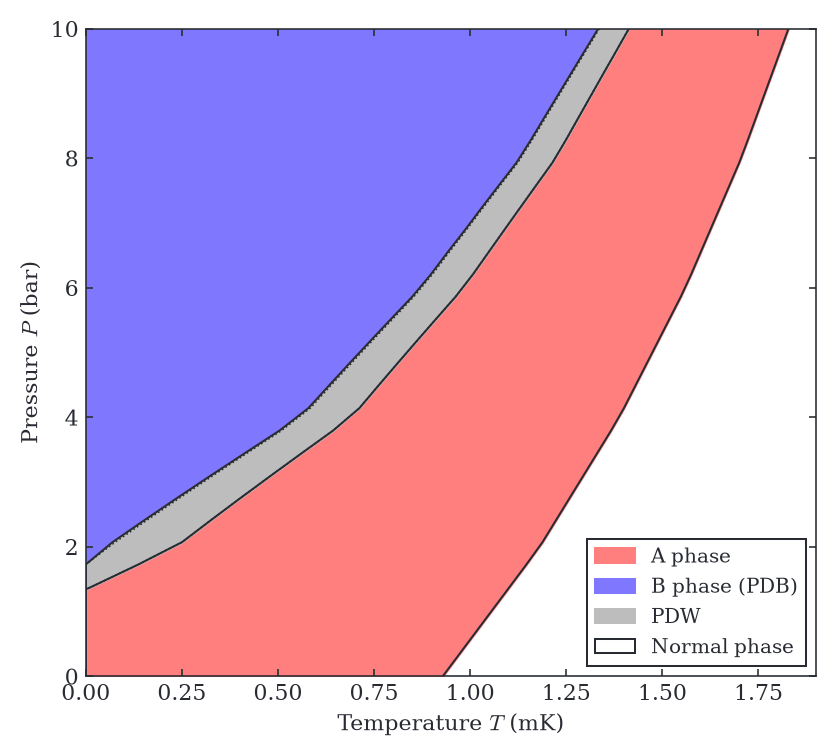
To construct this phase diagram, we repeated the mode calculation across temperature and pressure, then found where the PDW free energy falls below that of the planar-distorted B (PDB) phase. The cubic term allows this to happen before the mode fully softens, making the transition first order.
For a 300 nm slab, we find a PDW region between the A and PDB phases, in qualitative agreement with experiment. Similar results are obtained for the thicker slabs studied experimentally, but the PDW region is smaller.
The theoretical phase diagram
Loading interactive figure…
The crystal structure
We can compute the spatial structure in each of the order parameter’s nine components. Three terms dominate:  ,
 and
 . Choose a component and move the cut through the slab to see its structure.
Blue and red show opposite signs of the order parameter. These are different components of the same superfluid crystal, with a repeat distance of about 1 m.
The triangular PDW texture
· Loading interactive figure…
Cuts through the slab
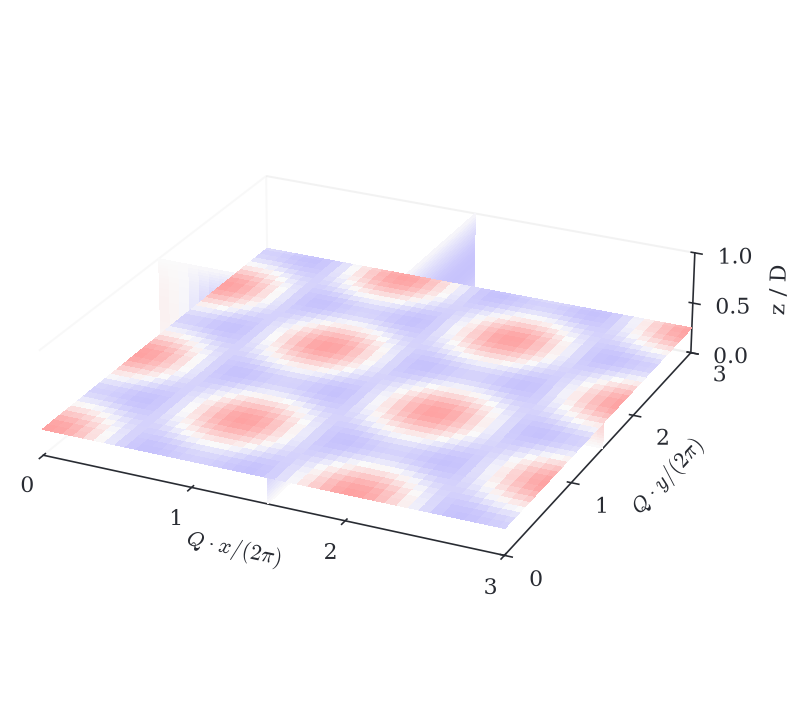
Horizontal slice
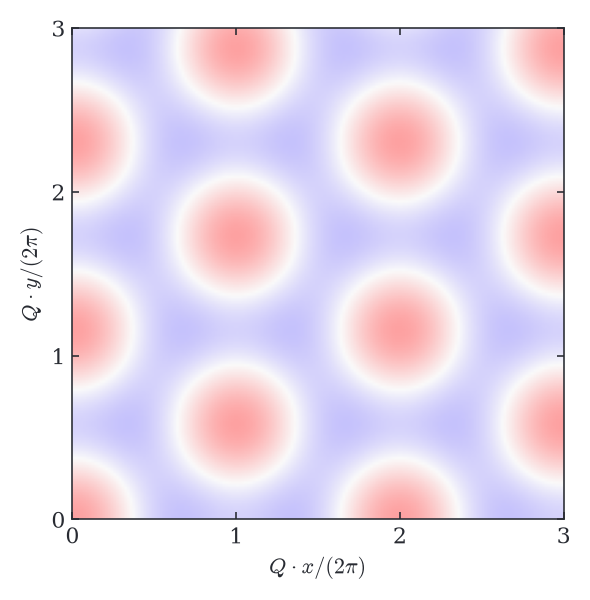
 is the magnitude of the modulation wavevector.Positive
How the texture is reconstructed
We display  . The reference
 is uniform in the plane and varies with depth.
 combines the calculated mode profiles with three in-plane waves. The depth slider moves a cut through a static field. It does not evolve the liquid in time.
The amplitude uses the original animation’s plotting convention. It is not an equilibrium amplitude or a temperature control. Component values retain the source calculation’s units; the colour range for each component stays fixed as you move the cut.
Conclusion
We have proposed a mechanism for a two-dimensional pair-density wave in confined helium-3. Landau’s weak crystallization lets us compute its phase diagram and predict a triangular crystal structure. The next question is how an experiment could identify that structure; different ways of looking at the order parameter could reveal different components of the pattern.
Paper and references
The research is by P. Senarath Yapa, Rufus Boyack and Joseph Maciejko: Triangular Pair-Density Wave in Confined Superfluid Helium-3, Physical Review Letters 128, 015301 (2022). The preprint is freely available.
- L. D. Landau, On the Theory of Phase Transitions I, Zh. Eksp. Teor. Fiz. 7, 627 (1937). Quotation reproduced from the original article manuscript.
- E. P. Gross, Quantum theory of interacting bosons, Annals of Physics 9, 292–324 (1960).
- D. Y. Kim and M. H. W. Chan, Absence of Supersolidity in Solid Helium in Porous Vycor Glass (2012), revisiting the 2004 torsional-oscillator claim.
- The 2019 dipolar-gas results: Böttcher et al., Tanzi et al. and Chomaz et al.
- A. B. Vorontsov and J. A. Sauls, Crystalline Order in Superfluid ³He Films (2007).
- L. V. Levitin et al., Evidence for a Spatially Modulated Superfluid Phase of ³He under Confinement (2019).
- A. J. Shook et al., Stabilized Pair Density Wave via Nanoscale Confinement of Superfluid ³He (2020).